... we have the phrase "There are lies, damned lies and statistics!"
The term was popularised in the United States by Twain (among others), who attributed it to the 19th-century British Prime Minister Benjamin Disraeli (1804–1881): "There are three kinds of lies: lies, damned lies, and statistics." However, the phrase is not found in any of Disraeli's works and the earliest known appearances were years after his death. Many other possible originators of the phrase have been proposed.
fbb has previously mentioned the Transport for London survey to justify withdrawal of District Line trains to Kensington Olympia, see "Dashed Green, Deleted District?" (read again). Here, TfL surveyed thousands and, surprisingly, the 80+% of those surveyed, presumably who travelled on the crowded Wimbledon branch, wanted more trains and the 15+% who travelled to Kensington Olympia didn't want to lose theirs.
A clear-cut statistical case for making the change for the benefit of the vast majority!!
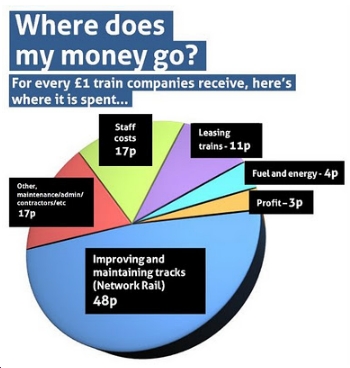
This lovely little pie chart ...
... was issued by the Association of Train Operating Companies at the time of the January fares hike (how can fares go on a hike?) ...
... to promote the misleading message that, "it ain't our fault, pal, blame Network Rail and/or the government!" Whilst everything that happens on the railways is inevitably coloured by state interference policy, ATOC members must accept at least part of the "blame" as they strive to maintain dividends for their shareholders.
Then there is this, emanating from TfL and quoted in the March edition of "Buses" magazine.
Either the majority are so well informed they don't need such detail, OR the buses are so frequent and reliable (?) that folk just go out and wait with a spring in their step and a face radiant with diurnal joy, OR the process of finding out is so convoluted that they don't even try. Whatever the reason, such a minimalist percentage is so small as to be negligible; which means TfL need not bother providing bus timetables at all, statistically! Which, of course, they don't.
But what do the remaining 7.4% of potential travellers ask, if not for bus times? Undergound times? Overgound times? Nationa Rail times? River Bus times? The mind boggles! A picture of the favourite bus? Complaints about late running? Fares enquiries? Colour of driver's socks?
And what does the 750,000 measure? On line, for example, mouse clicks, page views, site visits or enquiring e-mail addresses all give different statistics. The fact is, unsurprisingly, that this little news-bite is completely meaningless.
But it does suggest that the vast sums of money spent on electronic information provision is largely wasted. If it doesn't suggest that, then the reader needs a much more detailed (and independent) analysis of TfL's data to understand what the true implications are.
But it does suggest that the vast sums of money spent on electronic information provision is largely wasted. If it doesn't suggest that, then the reader needs a much more detailed (and independent) analysis of TfL's data to understand what the true implications are.
But fbb has a favourite statistic. It is this:-
The majority of people in Great Britain
have a higher than average
number of legs.
Absolutely true.
Very few people have MORE than TWO legs. A small number of people are disabled and have LESS than two legs. So the average number of legs is (slightly) less than two; and by far the majority have more than that average.
Thoughtful readers of the typical news-bite will, of course, realise that statistics are only quoted if they favour the point of view of the news-bite's instigator.
Like the oft quoted "Rail fares in GB are the most expensive in Europe", which we will look at tomorrow.
P.S. fbb sometimes struggles with percentages; apologies if the decimal points have been wrongly allocated. He's has five attempts (without calculator) since 0645! Such is the deep joy of decyphering statistics.
Next Blog : due Friday February 24th


No comments:
Post a Comment